anyvisa.app

Anyvisa
UK's leading online visa platform
300%
increase in application capacity
75%
reduction in support tickets
4.8/5
customer satisfaction score
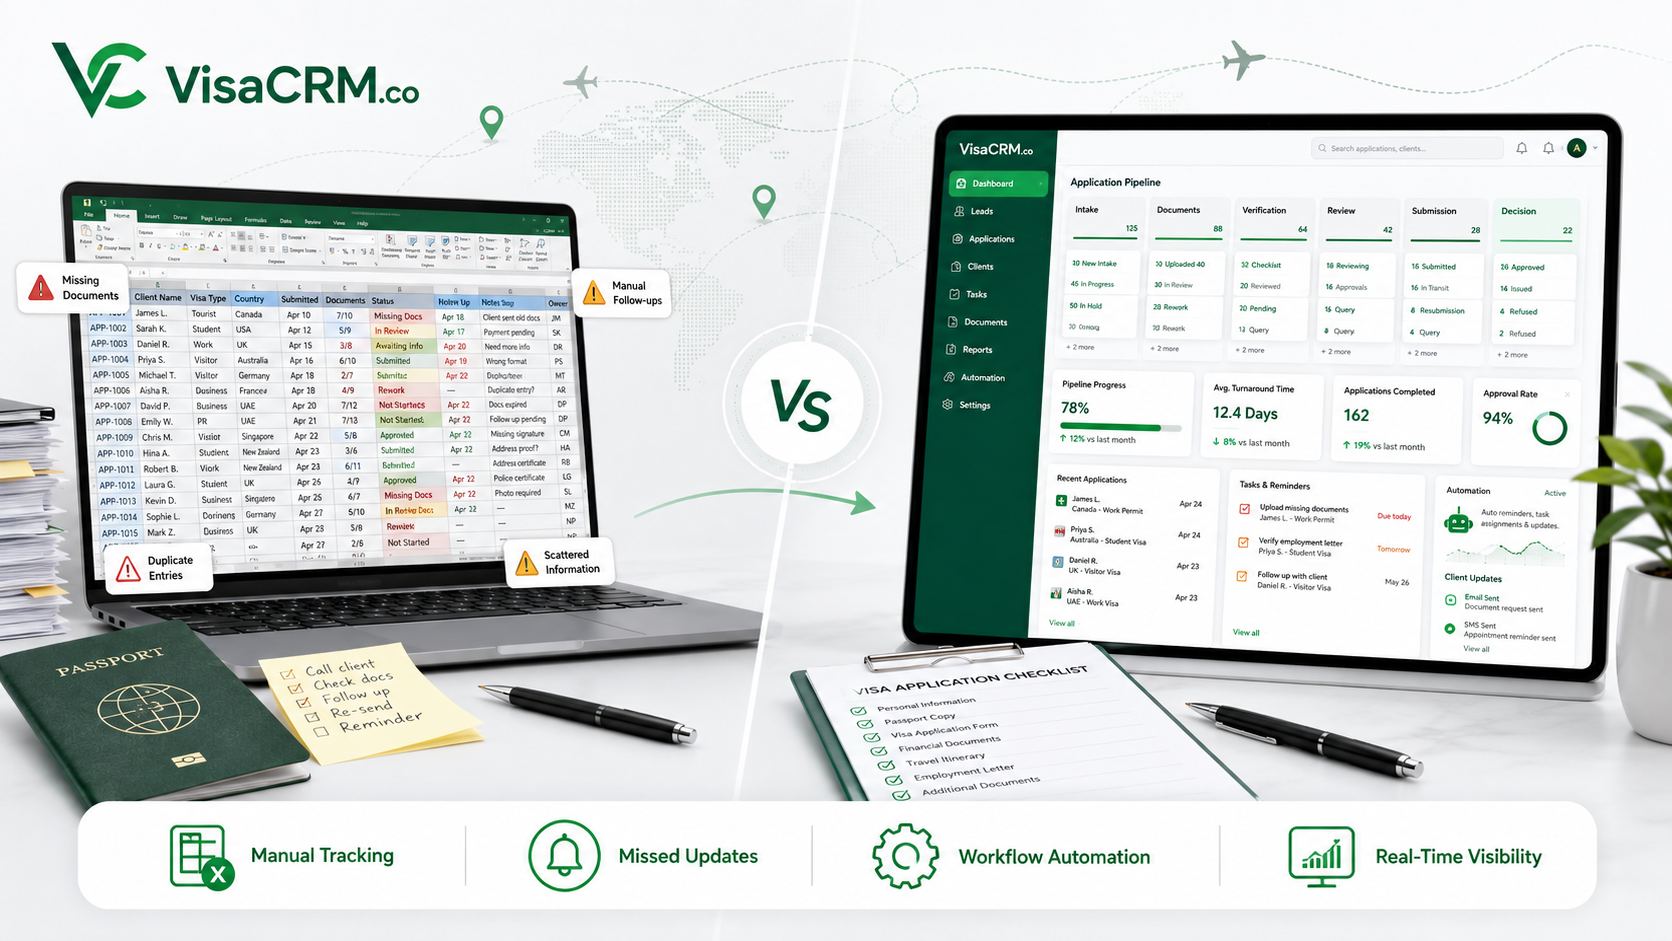
Data-driven decisions, not guesswork
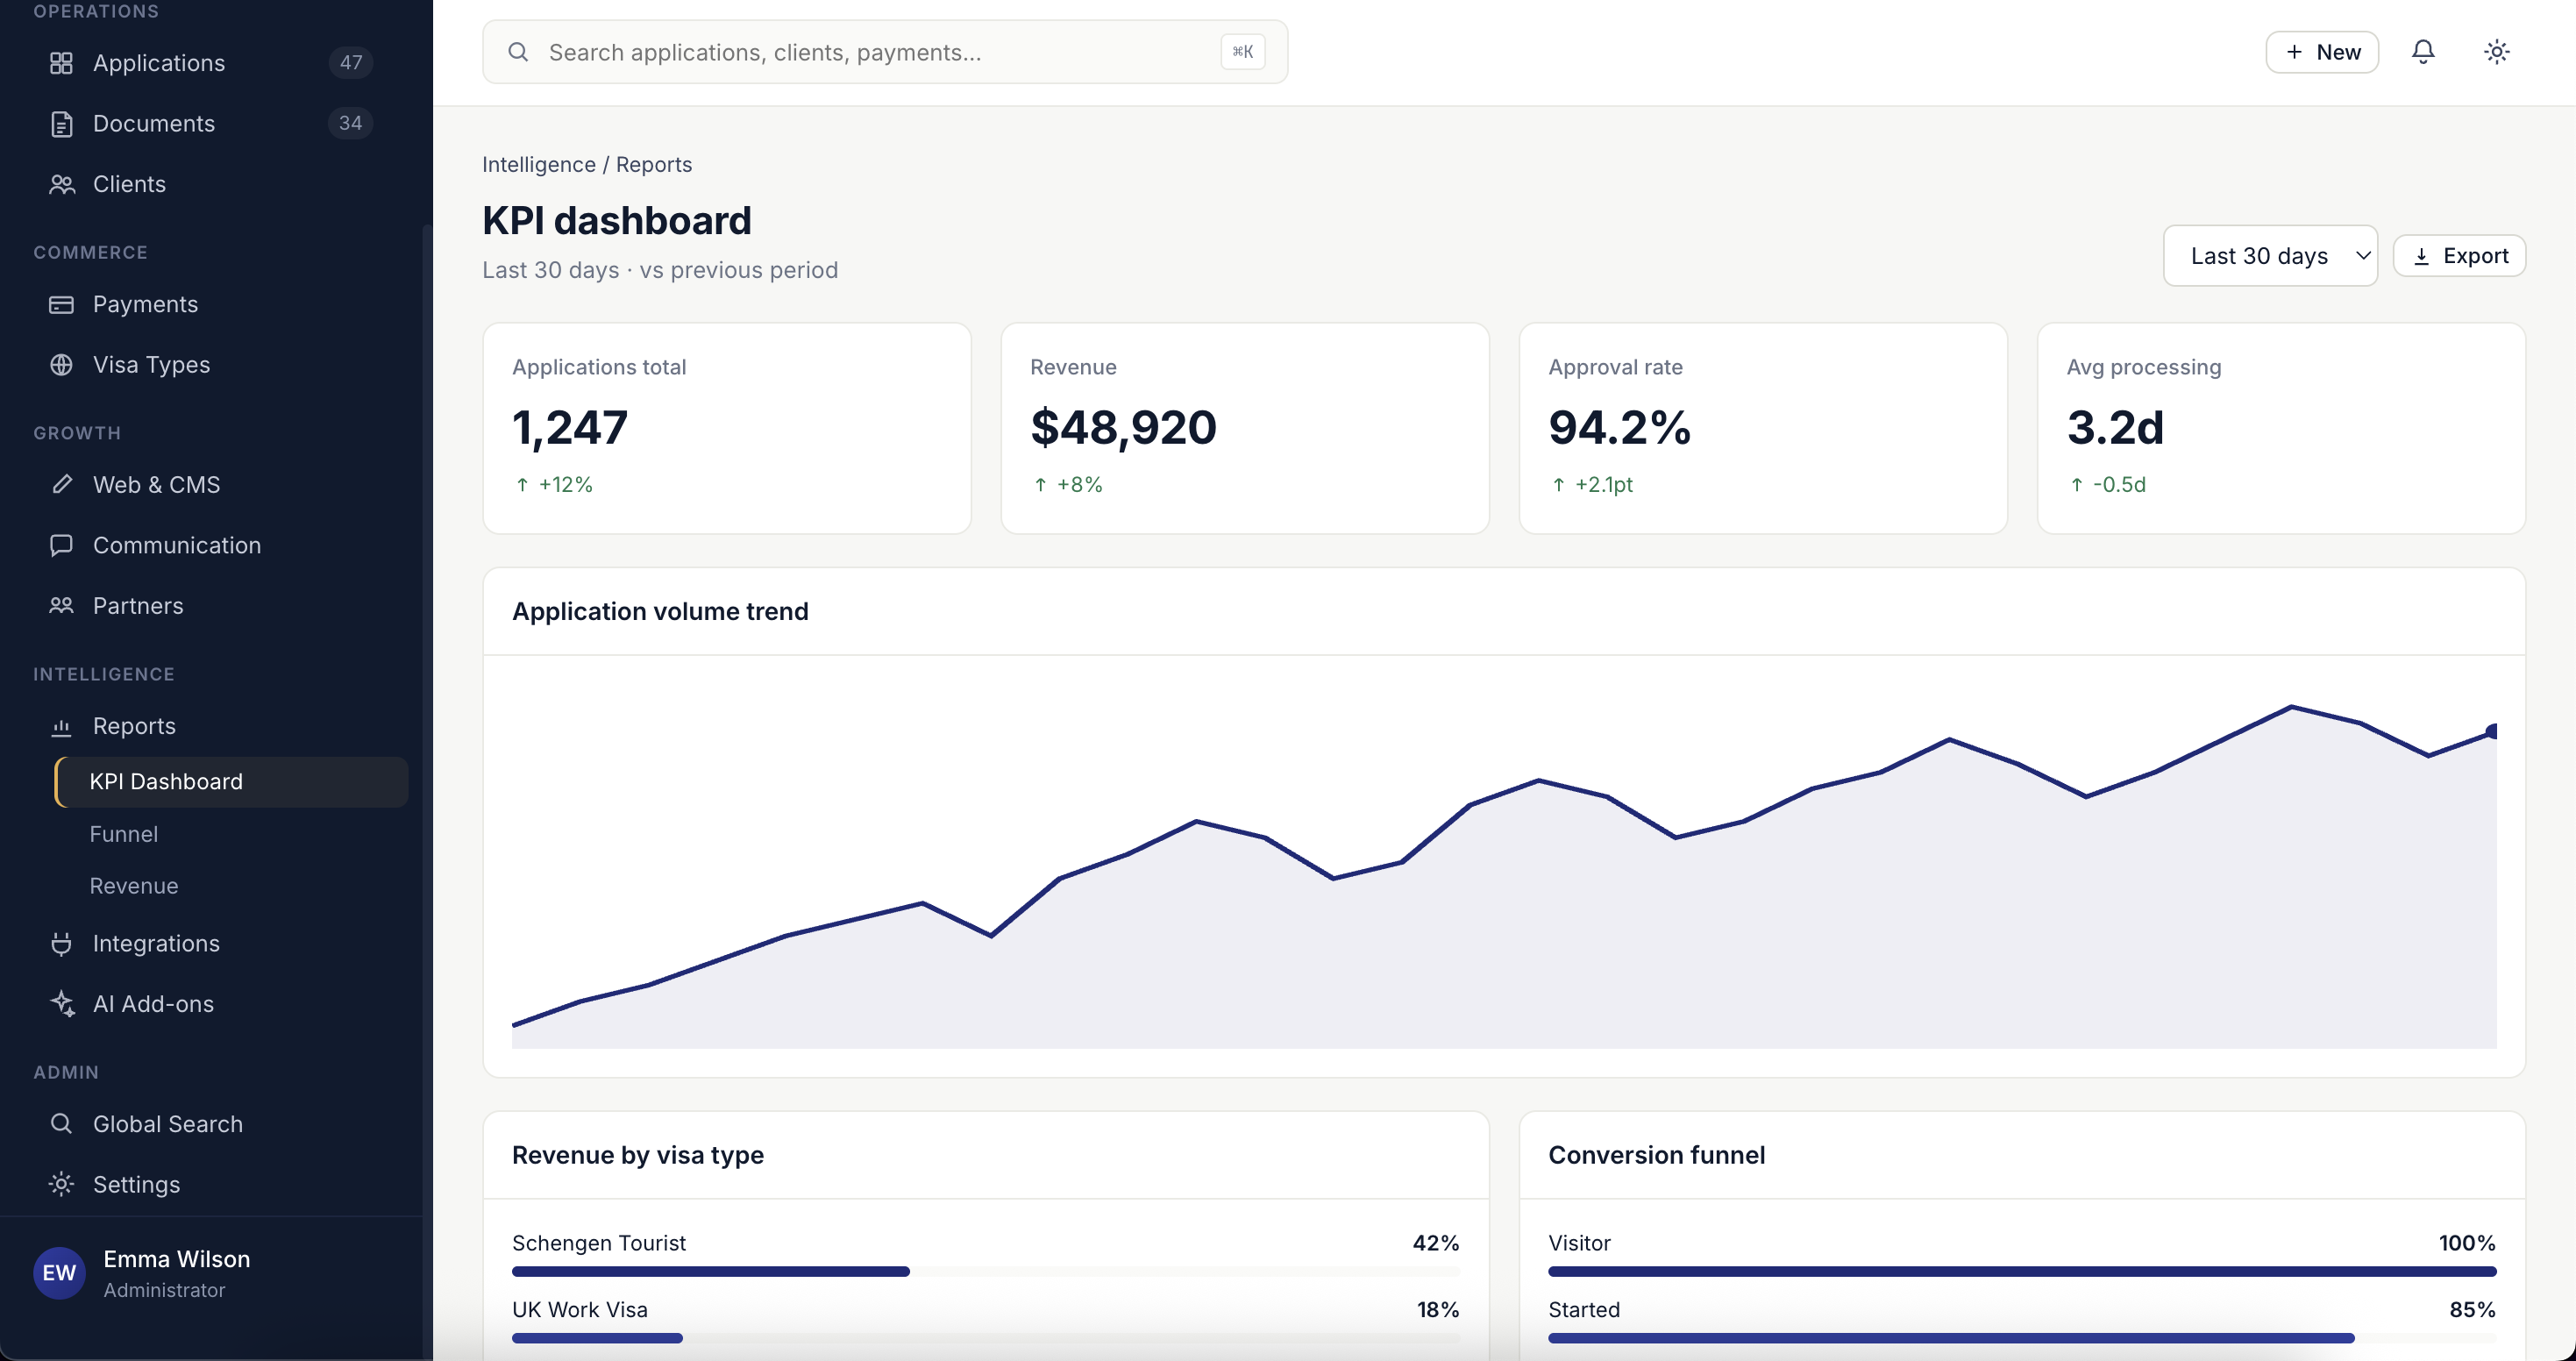
Real-time KPI dashboards, conversion funnels, revenue analytics, and exportable reports. See exactly how your visa business is performing.
Application volume, revenue, conversion rates, approval rates, and processing times — updated in real time across your team.
Visitor → application started → submitted → paid → approved. See exactly where clients drop off and fix the leaks.
Revenue by visa type, country, currency, and agent. Identify your most profitable segments and double down on them.
Applications per agent, processing time, approval rate, client satisfaction — measure and improve team performance.
Async CSV exports with S3 staging, PDF reports for compliance, Excel bulk exports for deep analysis.
Laravel Pulse for slow queries and exceptions. Sentry for error tracking. Health checks for database, queue, and security.
Book a demo and we'll tailor reporting & analytics to the way your team actually works.
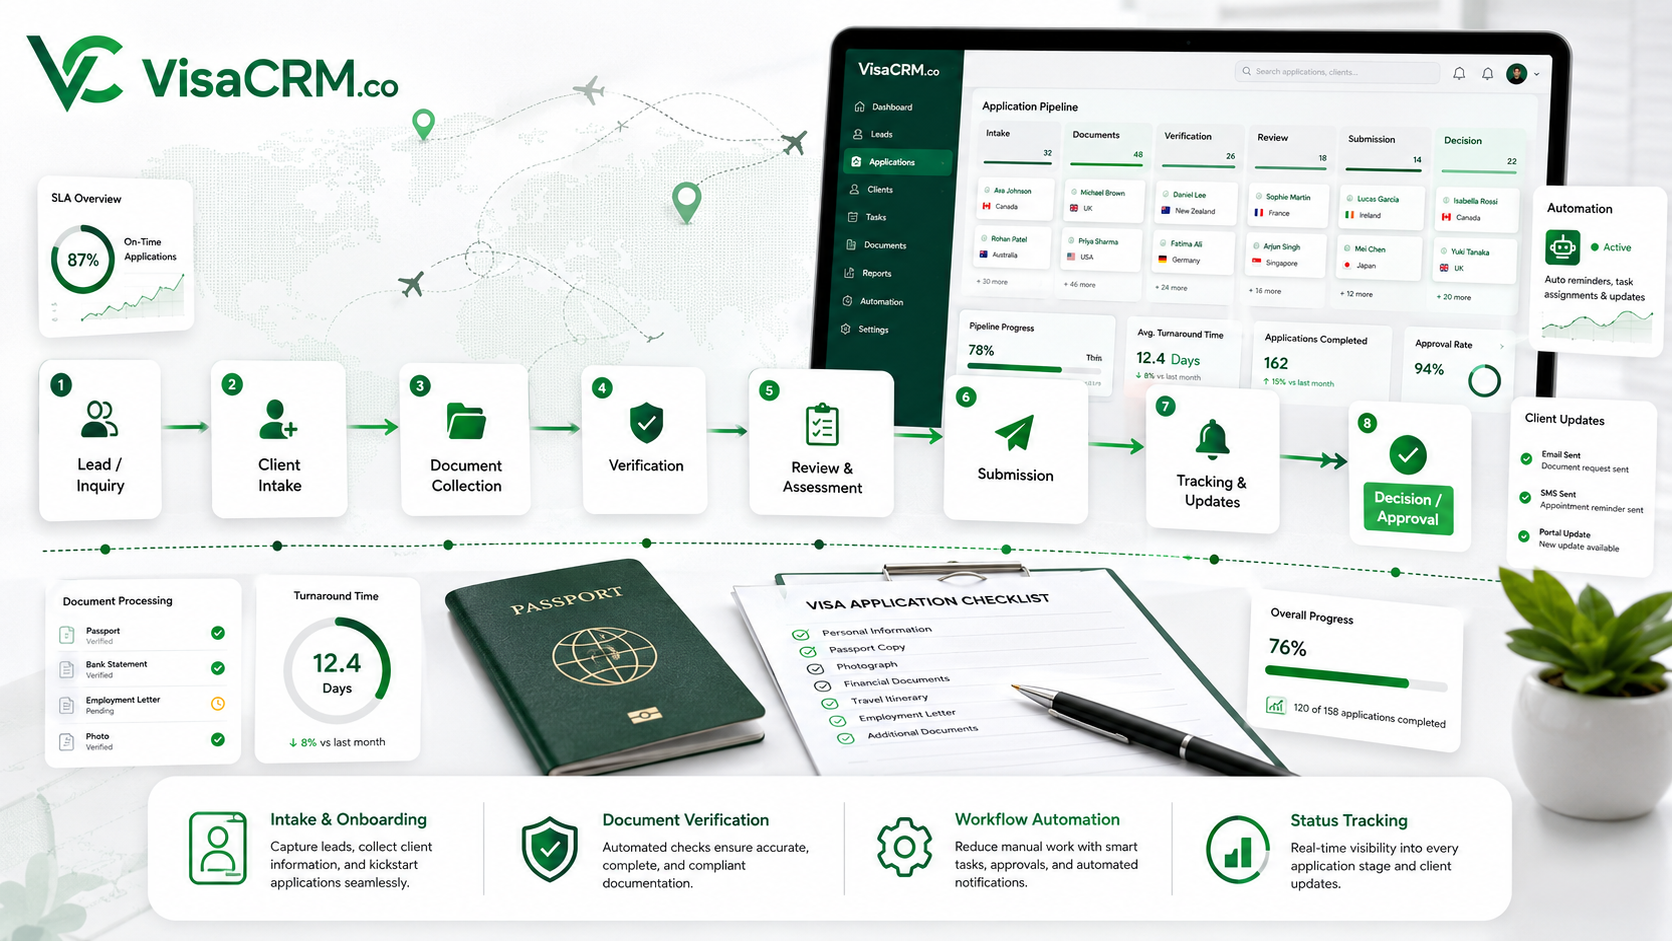
Book a demo →Every visa agency needs to track the same core metrics:
VisaCRM tracks all of these automatically. No manual data entry, no spreadsheet reconciliation. Every application that flows through the system contributes to your metrics.
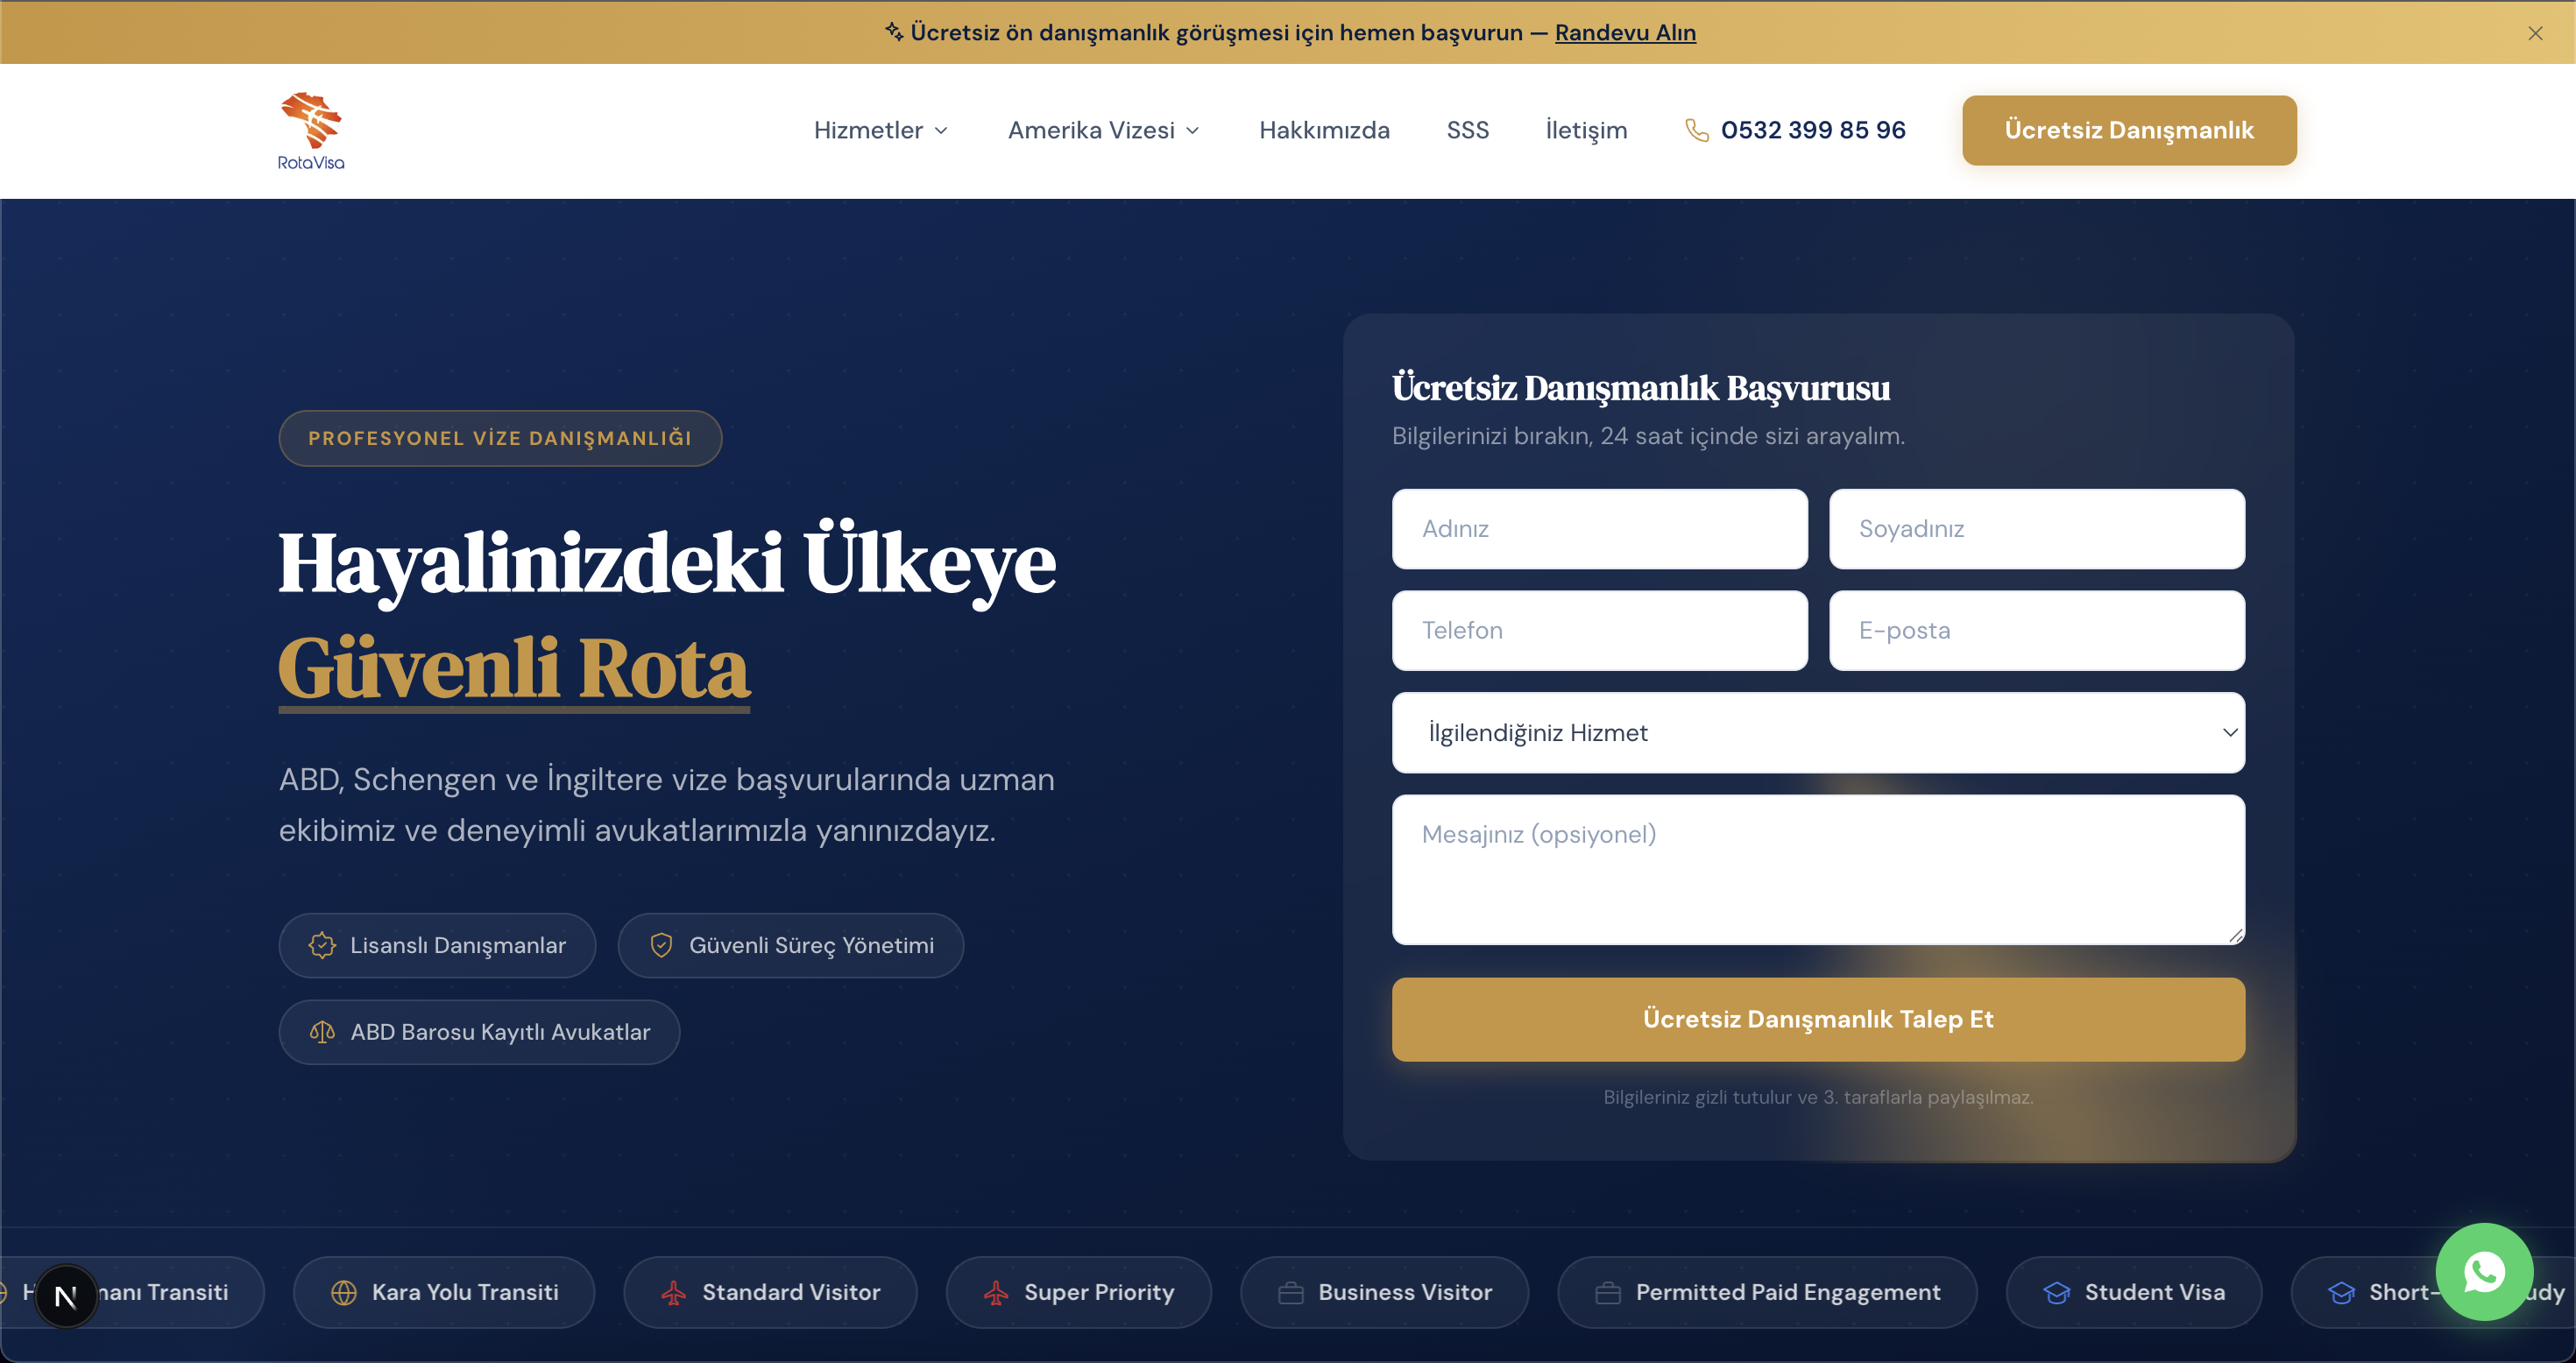
RotaVisa uses approval rate analytics as a key sales argument — demonstrating a verified 98% approval rate to prospective corporate clients.
Raw numbers are useful. Visualised data drives decisions. VisaCRM's reporting includes:
Date range filtering on every chart. Drill-down from aggregate metrics to individual applications. Export any view as an image for presentations.
Book a demo and we'll walk you through it with your visa types.
Reporting isn't just business metrics. It's also operational health.
Laravel Pulse tracks slow queries, request patterns, queue job performance, and exceptions. When something is degrading performance, you see it immediately — not after clients start complaining.
Sentry integration catches errors before they compound. Every exception is logged, stack-traced, and grouped. Critical errors trigger alerts.
Health checks monitor database connections, queue workers, CPU usage, disk space, and security configurations. Your system is observed 24/7, with alerts when thresholds are breached.
Every one of these platforms ships with the same backbone. Different brands, different visa types — one engine underneath.
Practical guides that go deeper on reporting & analytics and what it takes to run a modern visa business.
Book a call and we'll walk you through the platform with your specific workflow.
Book a discovery call →